GA4 Explorations: Build and Interpret Free-Form, Funnel and Path Analyses
September 1, 2026
Author: Shusaku Yosa
GA4 Explorations help investigate focused questions that emerge from routine reporting. The aim is not simply to build a flexible table. Define a question such as “Which landing pages or devices show less progression toward an accepted application among Organic Search sessions?” Then specify the observed data, the segment scope and the denominator before interpreting a difference.
Define the question and the limits of the observed data
Write down the dates, qualifying visits and success condition first. A button click and an accepted application are different states. If the required event was never collected, changing an exploration cannot reconstruct the missing historical action.
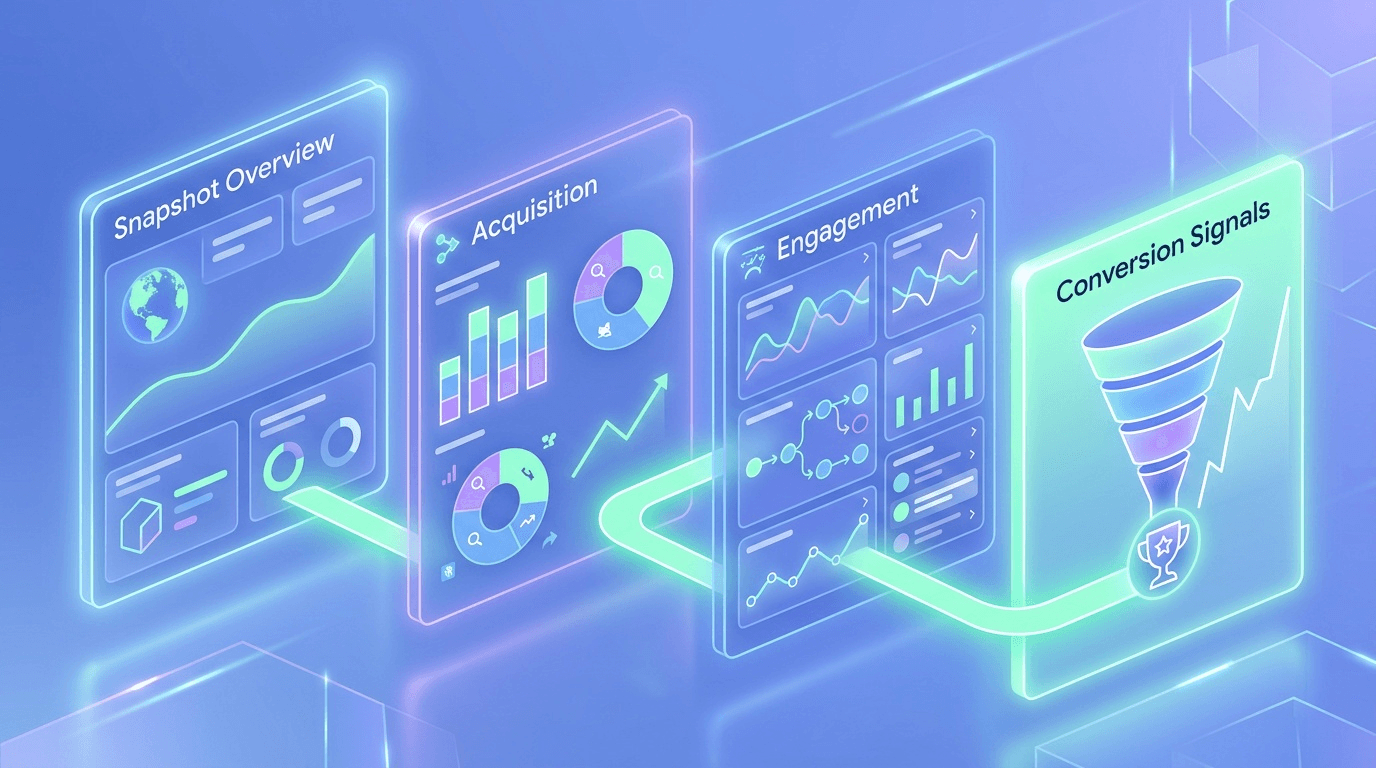
Explorations show patterns in observed data. They do not automatically establish why a journey stopped or whether a change caused an outcome. Use standard GA4 reports for routine coverage and bring a specific follow-up question into the exploration. Google’s Explorations overview explains the main workspace.
Choose free-form, funnel or path exploration
Technique | Useful question | Key limitation |
|---|---|---|
Free-form | How do metrics differ by landing page or device? | Selected dimensions and metrics must be compatible |
Funnel exploration | How many users progress through a defined sequence? | Order, entry rules and time limits determine inclusion |
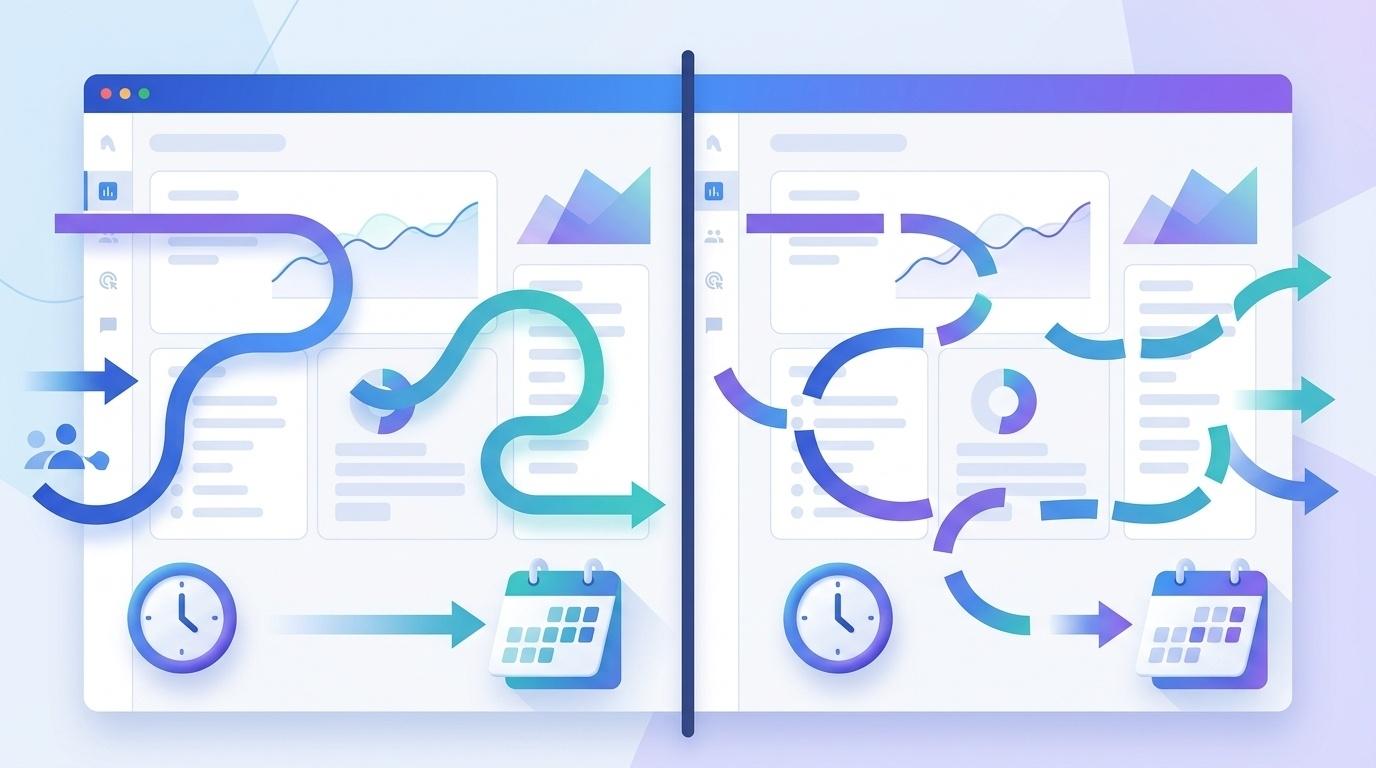
Path exploration | What measured events occur before or after a node? | Observed paths are not complete journeys or causal explanations |
A practical sequence is to identify a difference in free-form, then use a funnel if the necessary events and definitions are reliable. Standard reports can also be customized. Exploration is not the only editable reporting surface, and flexibility does not make every combination of fields meaningful or supported.
Build a free-form table with Variables, Settings and the canvas
- Choose free-form, name the analysis and select dates; record fixed dates for a reproducible comparison.
- Add the required dimensions, metrics and segments in Variables.
- Use Settings to choose rows, columns, values, filters and applied segments.
- Inspect the table or chart and confirm that the units and inclusion rules answer the question.
- If a field cannot be selected, check compatibility instead of substituting an unrelated metric.
For a device comparison of search entry, define the Organic Search condition at session scope, then consider landing page and device category alongside Sessions and Engaged sessions. Verify the available combinations in the actual exploration. The dimension and metric compatibility guidance helps distinguish unsupported combinations from genuinely missing observations.
Distinguish user, session and event segments
A user segment, session segment and event segment select different scopes. “Users who visited through Organic Search” is not the same population as “Organic Search sessions.” Use the segment documentation to choose the scope deliberately.
Fictional recorded visit | Recorded session channel |
|---|---|
User A, visit one | Organic Search |
User A, visit two | |
User B, visit one |
Selecting Organic Search sessions includes A’s first visit. A broader user condition selecting people who had an Organic Search visit can also include A’s other activity in the period. An analysis containing A’s two sessions is different from one containing only the qualifying search session. This example assumes that the channels were recorded exactly as shown.
An event segment selects qualifying events; it does not necessarily retain every event in the user’s history or every event in a session. Review the GA4 session definition when choosing scope, and name segments so another reader can see which unit they include.
Interpret funnel order, entry rules and denominators
Decide whether the funnel is closed or open, which order applies, whether intervening activity is allowed and whether steps have time limits. A closed funnel follows entry at the first step. An open funnel can include users entering at later steps. Read the funnel exploration documentation before comparing funnels with different settings.
Fictional closed funnel | Users and calculation |
|---|---|
Article viewed | 100 users meeting the defined conditions |
Form started | 60 progress; non-progression from the prior step is 40 ÷ 100 = 40% |
Accepted-submission event | 30 progress; non-progression from the prior step is 30 ÷ 60 = 50% |
First-to-final progression | 30 ÷ 100 = 30% |
These are users observed through the defined sequence, not raw counts of repeated event occurrences. They are not automatically verified new registrations either. If an open funnel permits later entry, distinguish those entrants rather than reusing the initial 100 as the denominator for every calculation. A stage percentage and an overall progression rate answer different questions.
Investigate missing data and differences from standard reports
For an empty table, first check event collection, dates, segment conditions and field compatibility. Detailed data used by Explorations is affected by retention settings. Aggregate standard reports may remain available for a period whose same detailed data is no longer available to explore. Consult the data-retention guidance and do not replace an unavailable value with zero.
Differences from standard reports can involve filters, processing, modeling, thresholds or sampling. Inspect data-quality indicators and Google’s Reports and Explorations comparison. Even text-matching behavior can differ between report search and exploration filters. Align the relevant conditions one at a time instead of assuming an exploration is inherently the more correct result.
Save date choices, sharing permissions and analysis notes
A saved relative date range moves when reopened later. Use fixed dates and a condition note when reproducing a before-and-after comparison. Sharing also differs from collaborative editing: the official guidance permits Analyst roles and above to share an exploration, and shared explorations are read-only. A recipient who needs to edit can duplicate it rather than assume everyone is changing the same analysis.
- Save the question, observable scope, property, dates and segment unit.
- Record funnel order, entry rules, time limits and metric denominators.
- Attach event success definitions and relevant quality or retention limitations.
- Separate the observed finding, the causal hypothesis and the next verification step.
If one device shows less progression, the next useful action may be testing its form or transition. Preserve the conditions that produced the finding so the test can be repeated. That creates a stronger improvement process than treating an observed path or percentage as proof of the underlying cause.