What Is Engagement Rate? Calculation Methods by Platform, Benchmarks & Proven Tactics to Boost It
March 28, 2026
Author: Shusaku Yosa
"I post regularly but get little response." "My follower count is growing, yet it doesn't translate into results." The root cause of the most common frustration in social media management lies in engagement rate. This article covers everything from the fundamentals of engagement rate and platform-specific formulas to industry benchmarks, plus cross-platform comparison data actually generated with NeX-Ray—providing practical knowledge you can apply immediately.
What Is Engagement Rate?
Definition of Engagement Rate
Engagement rate is a metric that measures how much users interact with a social media post. It is calculated by dividing the number of actions—likes, comments, shares, saves, clicks, etc.—by impressions, reach, or follower count.
The basic formula is:
Engagement Rate (%) = Engagements ÷ Denominator (Impressions, Reach, or Followers) × 100
The choice of denominator significantly changes the resulting value. When comparing internally over time, it is crucial to use the same denominator consistently. When benchmarking against competitors, make sure the denominator definitions match before drawing conclusions.
Why Follower Count Alone Is Not Enough
Suppose Account A has 100,000 followers and Account B has 10,000. At first glance, A appears more influential. However, if A averages 200 likes per post (0.2% engagement rate) while B averages 500 (5.0%), B clearly has a far stronger bond with its audience.
In 2026, every major social platform's algorithm treats high-engagement posts as "quality content" and actively surfaces them to non-followers. In other words, improving engagement rate is the most reliable way to expand organic reach for free.
Engagement Rate Formulas by Platform
The definition of engagement differs by platform. Understanding each formula and the actions it includes is the first step to accurate analysis.
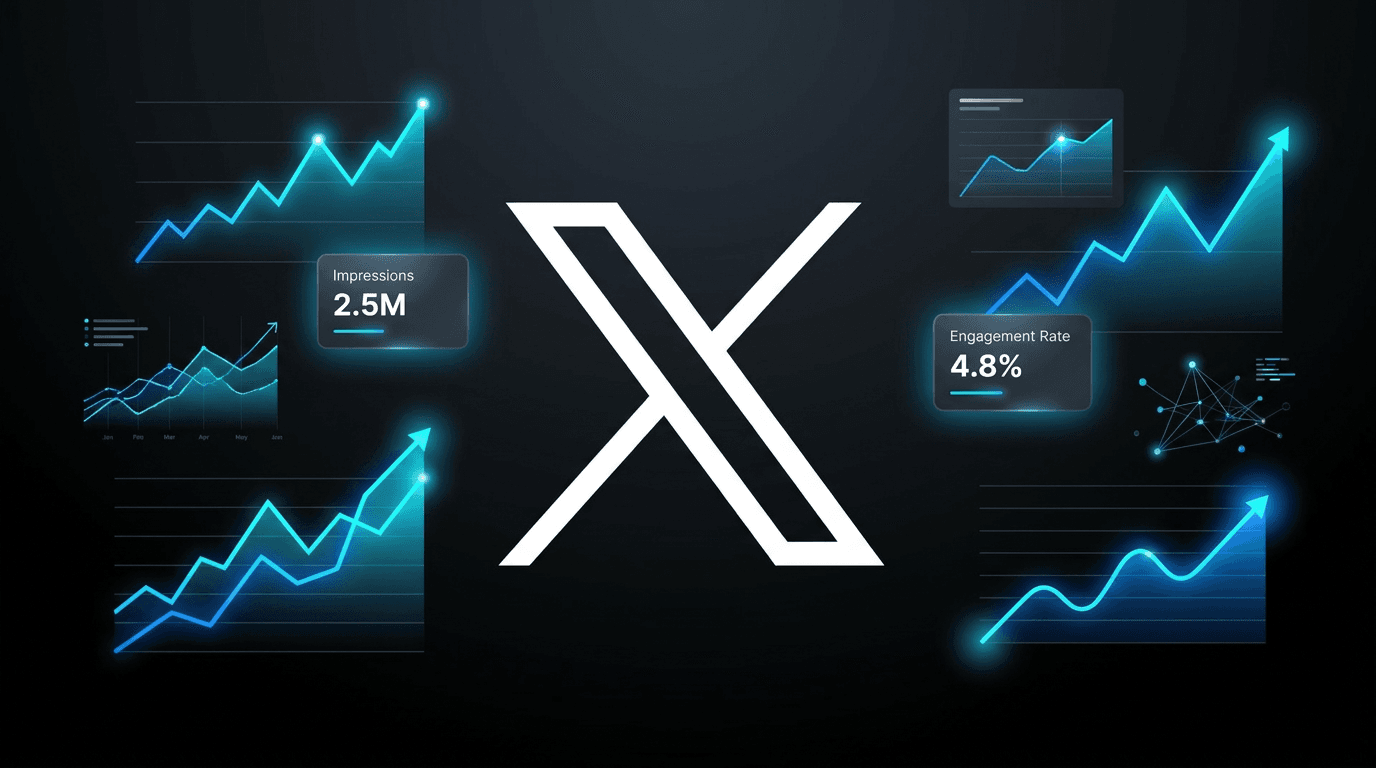
X (formerly Twitter)
X officially uses impressions as the denominator.
Engagement Rate = (Likes + Reposts + Replies + Clicks + Profile Views) ÷ Impressions × 100
Because X is highly real-time and the timeline moves fast, each post tends to have a shorter display window. As a result, impression-based engagement rates on X tend to appear lower compared to other platforms. Note that X's analytics dashboard automatically displays engagement rate per post, making daily monitoring straightforward.
Instagram does not officially display engagement rate, so you need to calculate it yourself. Engagements include four types of actions: likes, comments, saves, and shares.
Engagement Rate = (Likes + Comments + Saves + Shares) ÷ (Followers, Reach, or Impressions) × 100
Instagram's algorithm heavily weighs saves for Explore tab exposure. Posts that earn deeper engagement—saves and shares rather than simple likes—are the key to expanding reach. Using reach as the denominator aligns closely with Meta's Insights dashboard, while follower count is commonly used for competitive benchmarking.
Facebook officially uses reach (number of people who saw the post) as the denominator.
Engagement Rate = (Reactions + Comments + Shares + Clicks) ÷ Reach × 100
A key characteristic of Facebook is that both numerator and denominator are counted in unique people. Even if one user reacts and shares (two actions), it counts as one engaged person. This can make rates appear slightly lower in direct comparisons with other platforms. Facebook offers seven types of reactions beyond the standard like—Love, Care, Haha, Wow, Sad, and Angry—all counted as engagement.
TikTok
TikTok has exceptionally strong reach beyond followers, and video views are typically used as the denominator.
Engagement Rate = (Likes + Comments + Shares + Saves) ÷ Video Views × 100
TikTok's algorithm places special emphasis on completion rate—whether users watch the video to the end—which greatly affects recommendation placement. Monitoring average watch time and completion rate alongside engagement rate is essential for TikTok success.
Engagement Rate Benchmarks by Platform
All-Industry Median (Follower-Based)
According to Rival IQ's 2025 Social Media Industry Benchmark Report, the all-industry median engagement rate is approximately 0.36% on Instagram, 0.06% on Facebook, and 0.03% on X. TikTok is measured on a view basis and cannot be directly compared, but generally falls in the 5–9% range. Year-over-year declines have been observed across all platforms, meaning past benchmarks no longer apply. These are global figures; trends in your specific market may differ by industry and account size. What matters most is tracking your own trends over time and comparing against direct competitors.
The Denominator Effect of Follower Size
Engagement rate tends to decline as follower count grows—a phenomenon known as the denominator effect, caused by the increasing proportion of inactive and casual users. Micro-influencers (1,000–100,000 followers) generally record higher engagement rates than mega accounts. Don't automatically assume your rate is poor if it falls below the industry average; compare against accounts of similar size before deciding whether improvement is needed.
[NeX-Ray Data] What We Learned from Cross-Platform Engagement Comparison
NeX-Ray enables centralized management of marketing data. Here we share a real analysis case where we used NeX-Ray to compare engagement across multiple social accounts operated by the same brand.
Analysis Methodology
We connected four accounts—X, Instagram, Facebook, and TikTok—to NeX-Ray, standardized engagement rate calculations to a follower-based denominator, and compared weekly trends over a three-month period. Normalizing each platform's native definitions to a common denominator within NeX-Ray makes true cross-media performance comparison possible.
Three Insights from Cross-Platform Comparison
First, TikTok's engagement rate was 3–5× higher than other platforms, but its follower conversion rate was lower. Because much of TikTok's traffic comes from the For You feed, one-time views are common, and shifting budget based on engagement rate alone carries risk.
Second, Instagram posts with a high save rate also showed higher overall engagement rates. How-to and checklist-style carousel posts were especially likely to be saved, directly boosting algorithmic ranking.
Third, on X, posting timing had the greatest impact. Posts published around 12 PM and 9 PM on weekdays had roughly 1.8× higher engagement rates than other time slots, with timing often outweighing content differences.
By analyzing data from multiple platforms under a unified standard—as NeX-Ray enables—you can clearly identify each platform's strengths and areas for improvement. Looking beyond the overall engagement rate to break down its components (like ratio, save ratio, comment ratio, etc.) leads to more actionable improvement strategies.
7 Proven Techniques to Boost Engagement Rate
Here are seven improvement techniques that work across all platforms.
1. Refine Your Persona
A broad target like "women in their 20s" leads to generic content that resonates with no one. Define your persona specifically—for example, "28-year-old marketing professional in Tokyo, interested in side hustles, checks Instagram during her commute"—and your content tone and themes will naturally sharpen, making it easier to earn genuine engagement.
2. Optimize Posting Times with Data
Common peak hours for social media usage include morning commute (7–9 AM), lunch break (12–1 PM), evening commute (6–8 PM), and relaxation time (9–11 PM). However, the ideal posting time varies by your follower demographics. Use each platform's insights or NeX-Ray's time-slot analysis to identify the optimal window for your specific account.
3. Design Content That Gets Saved
On Instagram and TikTok, saves significantly influence Explore and recommendation exposure. Content most likely to be saved includes how-tos, checklists, step-by-step guides, and comparison charts—anything users want to revisit later. Carousel posts and summary-style short videos tend to have higher save rates.
4. Systematize Comment Replies
Replying to comments not only directly boosts engagement rate but also signals to algorithms that the post has active conversation. As a guideline, always reply to comments within the first hour after posting and provide thoughtful responses to questions. Establishing these rules stabilizes your engagement operations.
5. Leverage Short-Form Video
Driven by TikTok's influence, short-form video engagement rates remain high across Instagram Reels and YouTube Shorts. Reels often achieve 2–3× the reach of static image posts, and their algorithmic advantage is clear. If video feels intimidating, start with slideshow-style or text-animation formats to lower the barrier.
6. Embed CTAs in Your Posts
Simple prompts like "Save this post if you found it helpful" or "Which do you prefer? Tell us in the comments" can noticeably lift engagement rate. Place CTAs at the beginning of the post or at the end of your caption for maximum effect.
7. Run a Regular Analysis and Improvement Cycle
At a minimum, measure engagement rate monthly, breaking it down by post type, day/time, and topic. Rather than reacting to short-term fluctuations, form hypotheses about why rates rose or fell and test them in subsequent posts. This PDCA cycle is the fastest path to results. With NeX-Ray, you can manage multi-platform data in a single dashboard, dramatically reducing analysis effort.
Key Considerations When Analyzing Engagement Rate
Standardize Your Denominator
A "3% engagement rate" means entirely different things depending on whether the denominator is followers or impressions. Always specify which denominator you're using in internal reports and competitive analyses. Changing the denominator midway makes time-series comparisons impossible, so pick one at the start and stick with it.
Avoid Simple Cross-Platform Comparisons
Because X and Instagram differ fundamentally in their formulas and user behavior, concluding "X isn't working because its engagement rate is lower" is a mistake. Assign each platform a role—awareness, fan nurturing, conversion driving—and set appropriate KPIs for each.
Look at Both Rate and Volume
Even a high engagement rate has limited business impact if reach is small. Conversely, a low rate with massive impressions may still contribute to brand awareness. Optimize your posting strategy by considering the balance between rate and volume.
Conclusion
Engagement rate is one of the most critical metrics for accurately evaluating social media performance. Each platform has a different formula, so understanding the precise definitions is essential. According to Rival IQ's 2025 report, engagement rates are declining across industries—but tracking your own trends and benchmarking against peers matters more than absolute numbers. By executing the seven techniques—persona refinement, timing optimization, save-worthy content design, comment reply systems, short-form video, CTAs, and regular analysis—you can steadily improve your engagement rate.
With NeX-Ray, you can compare engagement data across X, Instagram, Facebook, and TikTok under a unified standard and instantly identify each platform's strengths and improvement areas. Leverage data-driven social media management to deepen follower relationships and drive business results.